The Problem
We Are The New Farmers was unusual in its operational scope. We owned the entire stack: farming fresh spirulina in Brooklyn, manufacturing and packaging in our own facility, running a cold-chain fulfillment center in-house, and managing all sales and brand channels ourselves. No 3PL, no co-manufacturer, no agency. Every system in the business had to be built from scratch.
Running a perishable DTC business is an operations problem that most software is not built for. Fresh spirulina is harvested the same day it ships. Dry ice is ordered to match the exact number of outgoing orders. Boxes are prepped the night before. Everything is packed and out the door before a 4pm overnight pickup. There is no slack in the system.
When I was doing this manually, it meant spending hours every week counting orders, calculating dry ice quantities, building prep lists, and cross-referencing inventory against incoming shipments. None of that is a high-value use of a founder's time. More importantly, doing it manually meant the process lived in my head rather than in a shared system. One miscalculation on a shipping day could mean wasted product, missed orders, or a customer receiving a thawed perishable food package.
"Planning a shipping day is a logistics problem, not a leadership problem. I built this system to remove myself from the planning loop entirely and give that time back to running the business."
What I Built
A three-database system in Airtable, connected by 49 automations, that handled the full operational stack from incoming Shopify order to packing list to performance dashboard. Every part of the fulfillment process that could be systematized was systematized. What remained for the team was execution, not planning.
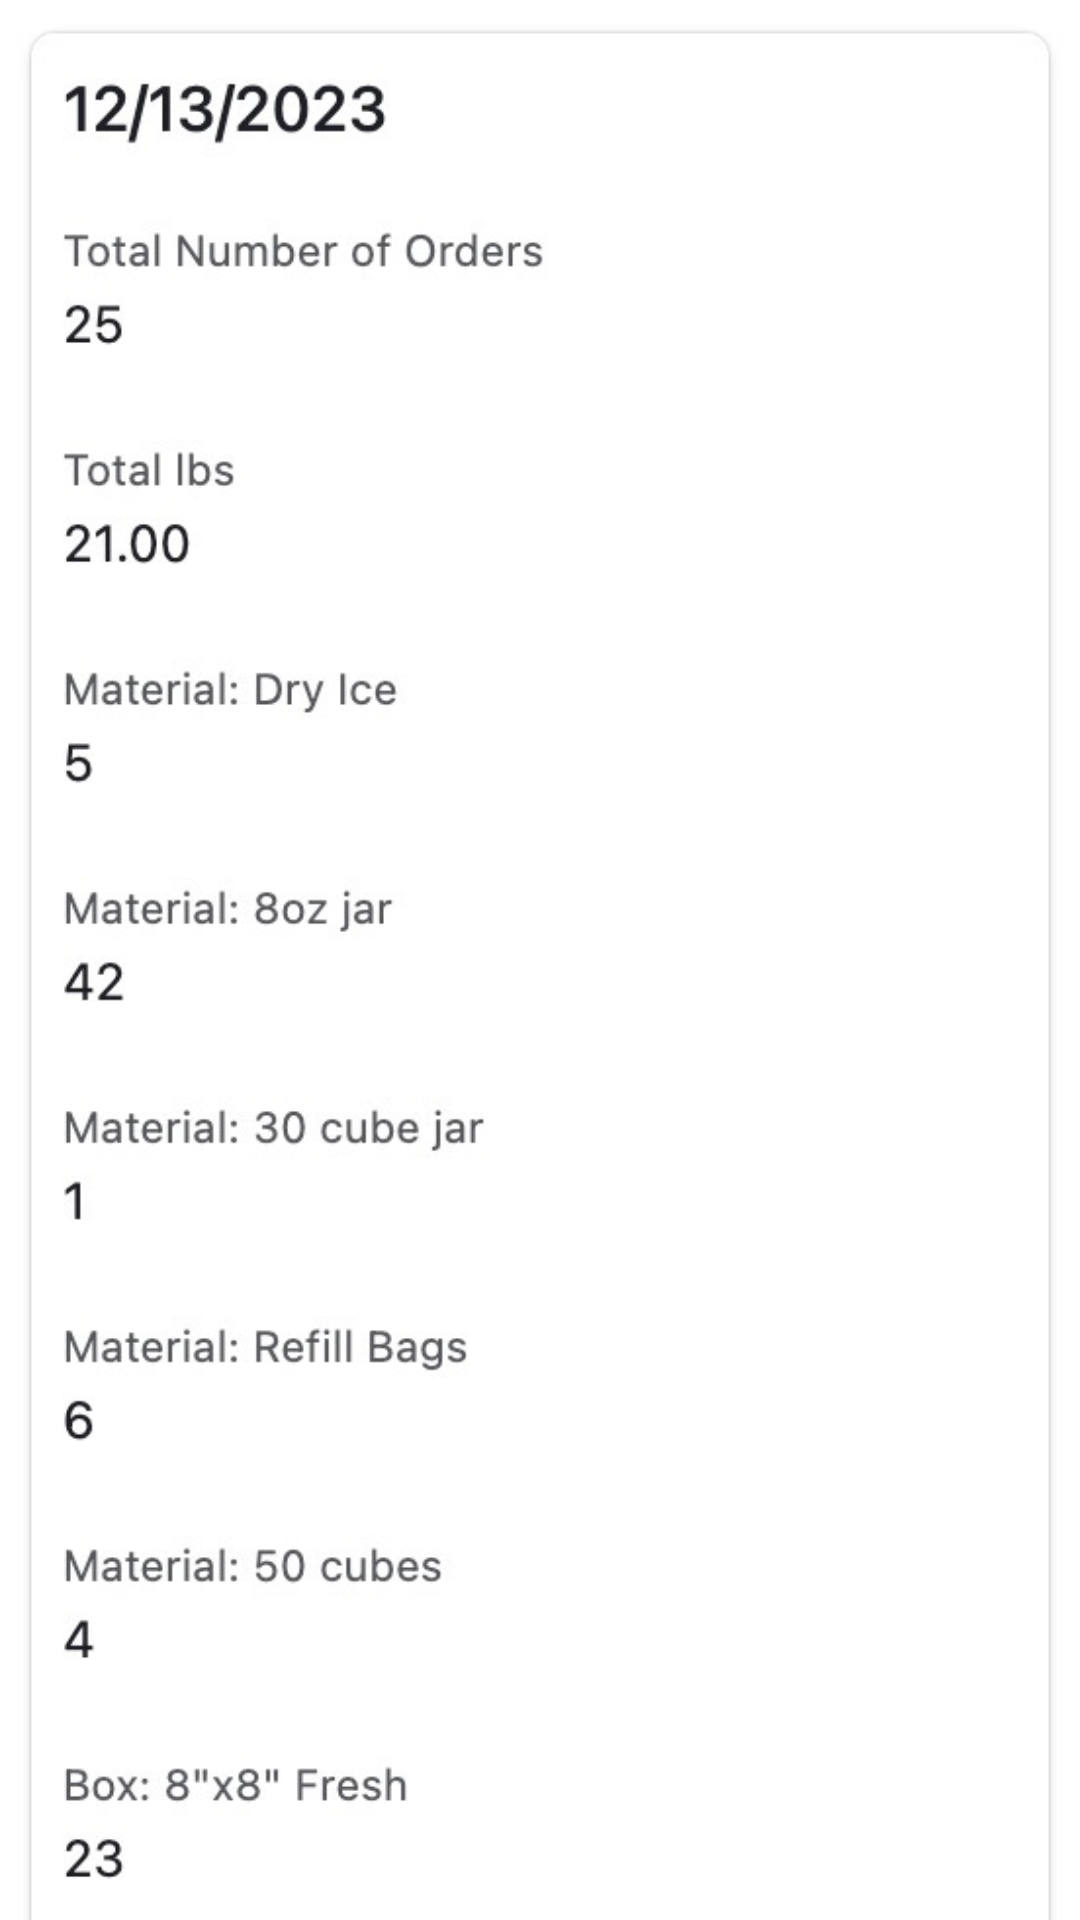
Shipping day prep list for December 13, 2023. 25 orders, 21 lbs dry ice, 42 jars, all box sizes pre-calculated.
Fulfillment in Practice
The clearest way to understand the system is to look at a real shipping day. Every morning, the database generated a complete prep and packing list from the previous night's orders, with no manual work required. The team knew exactly what to pull, what to pack, and what time they were working toward.
For this shipping day: 25 orders required exactly 21 lbs of dry ice across 5 blocks, 42 jars of fresh product, 1 frozen jar, 6 refill bags, and a precise count of small, medium, and large boxes to be prepped the night before.
Before the system existed, generating this list required manually cross-referencing Shopify orders against inventory sheets and doing the calculations by hand. That process took 45 to 60 minutes per shipping day.
After the system was built, the list was ready automatically each morning. The team focused entirely on execution. The 4pm pickup was never missed.
Sales and Performance Visibility
The sales layer was built to answer the questions that Shopify's native reporting couldn't: What is the true cost per order? Which product variant is most profitable? What is our subscriber churn? How is cohort retention trending? The output was a multi-view dashboard covering monthly performance, product mix, margins, and subscriber behavior.
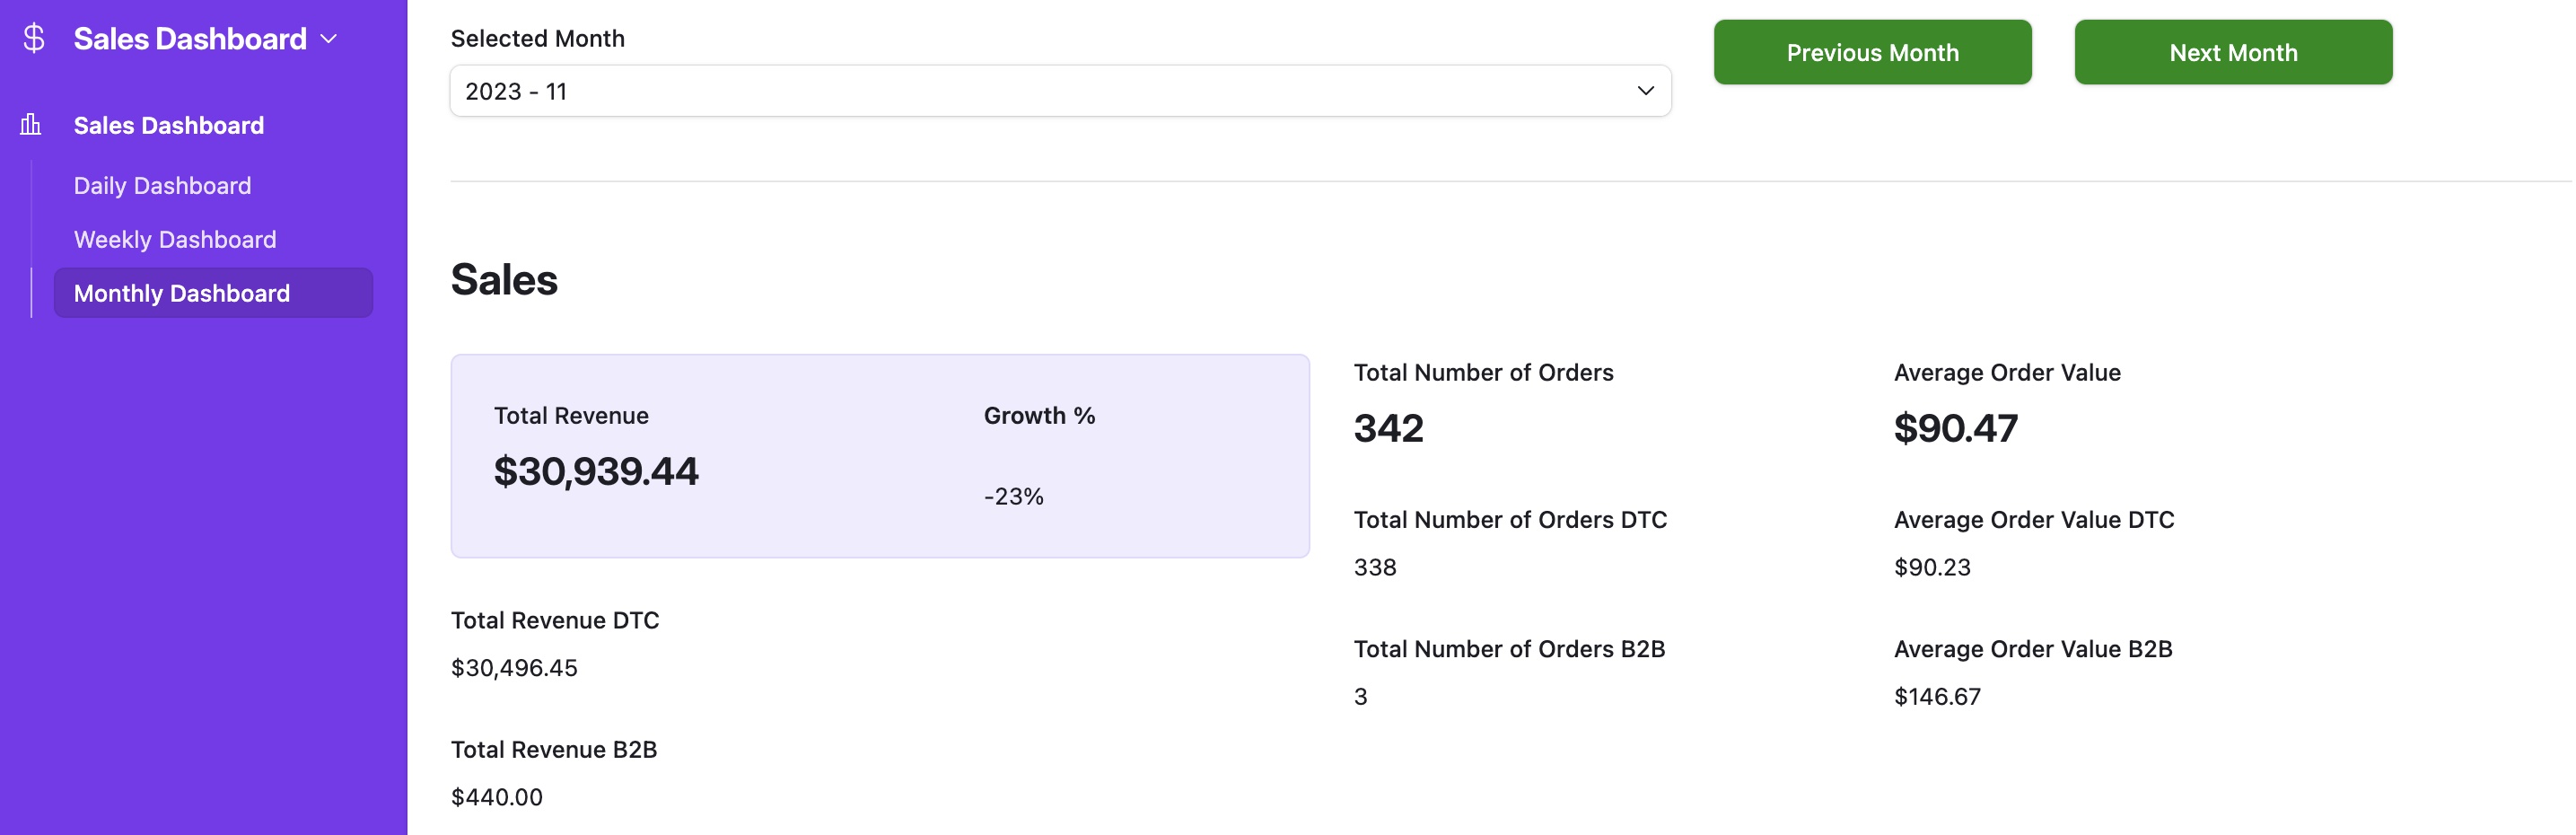
Monthly sales dashboard. November 2023: $30,939 revenue across 342 orders. DTC and B2B split tracked separately.
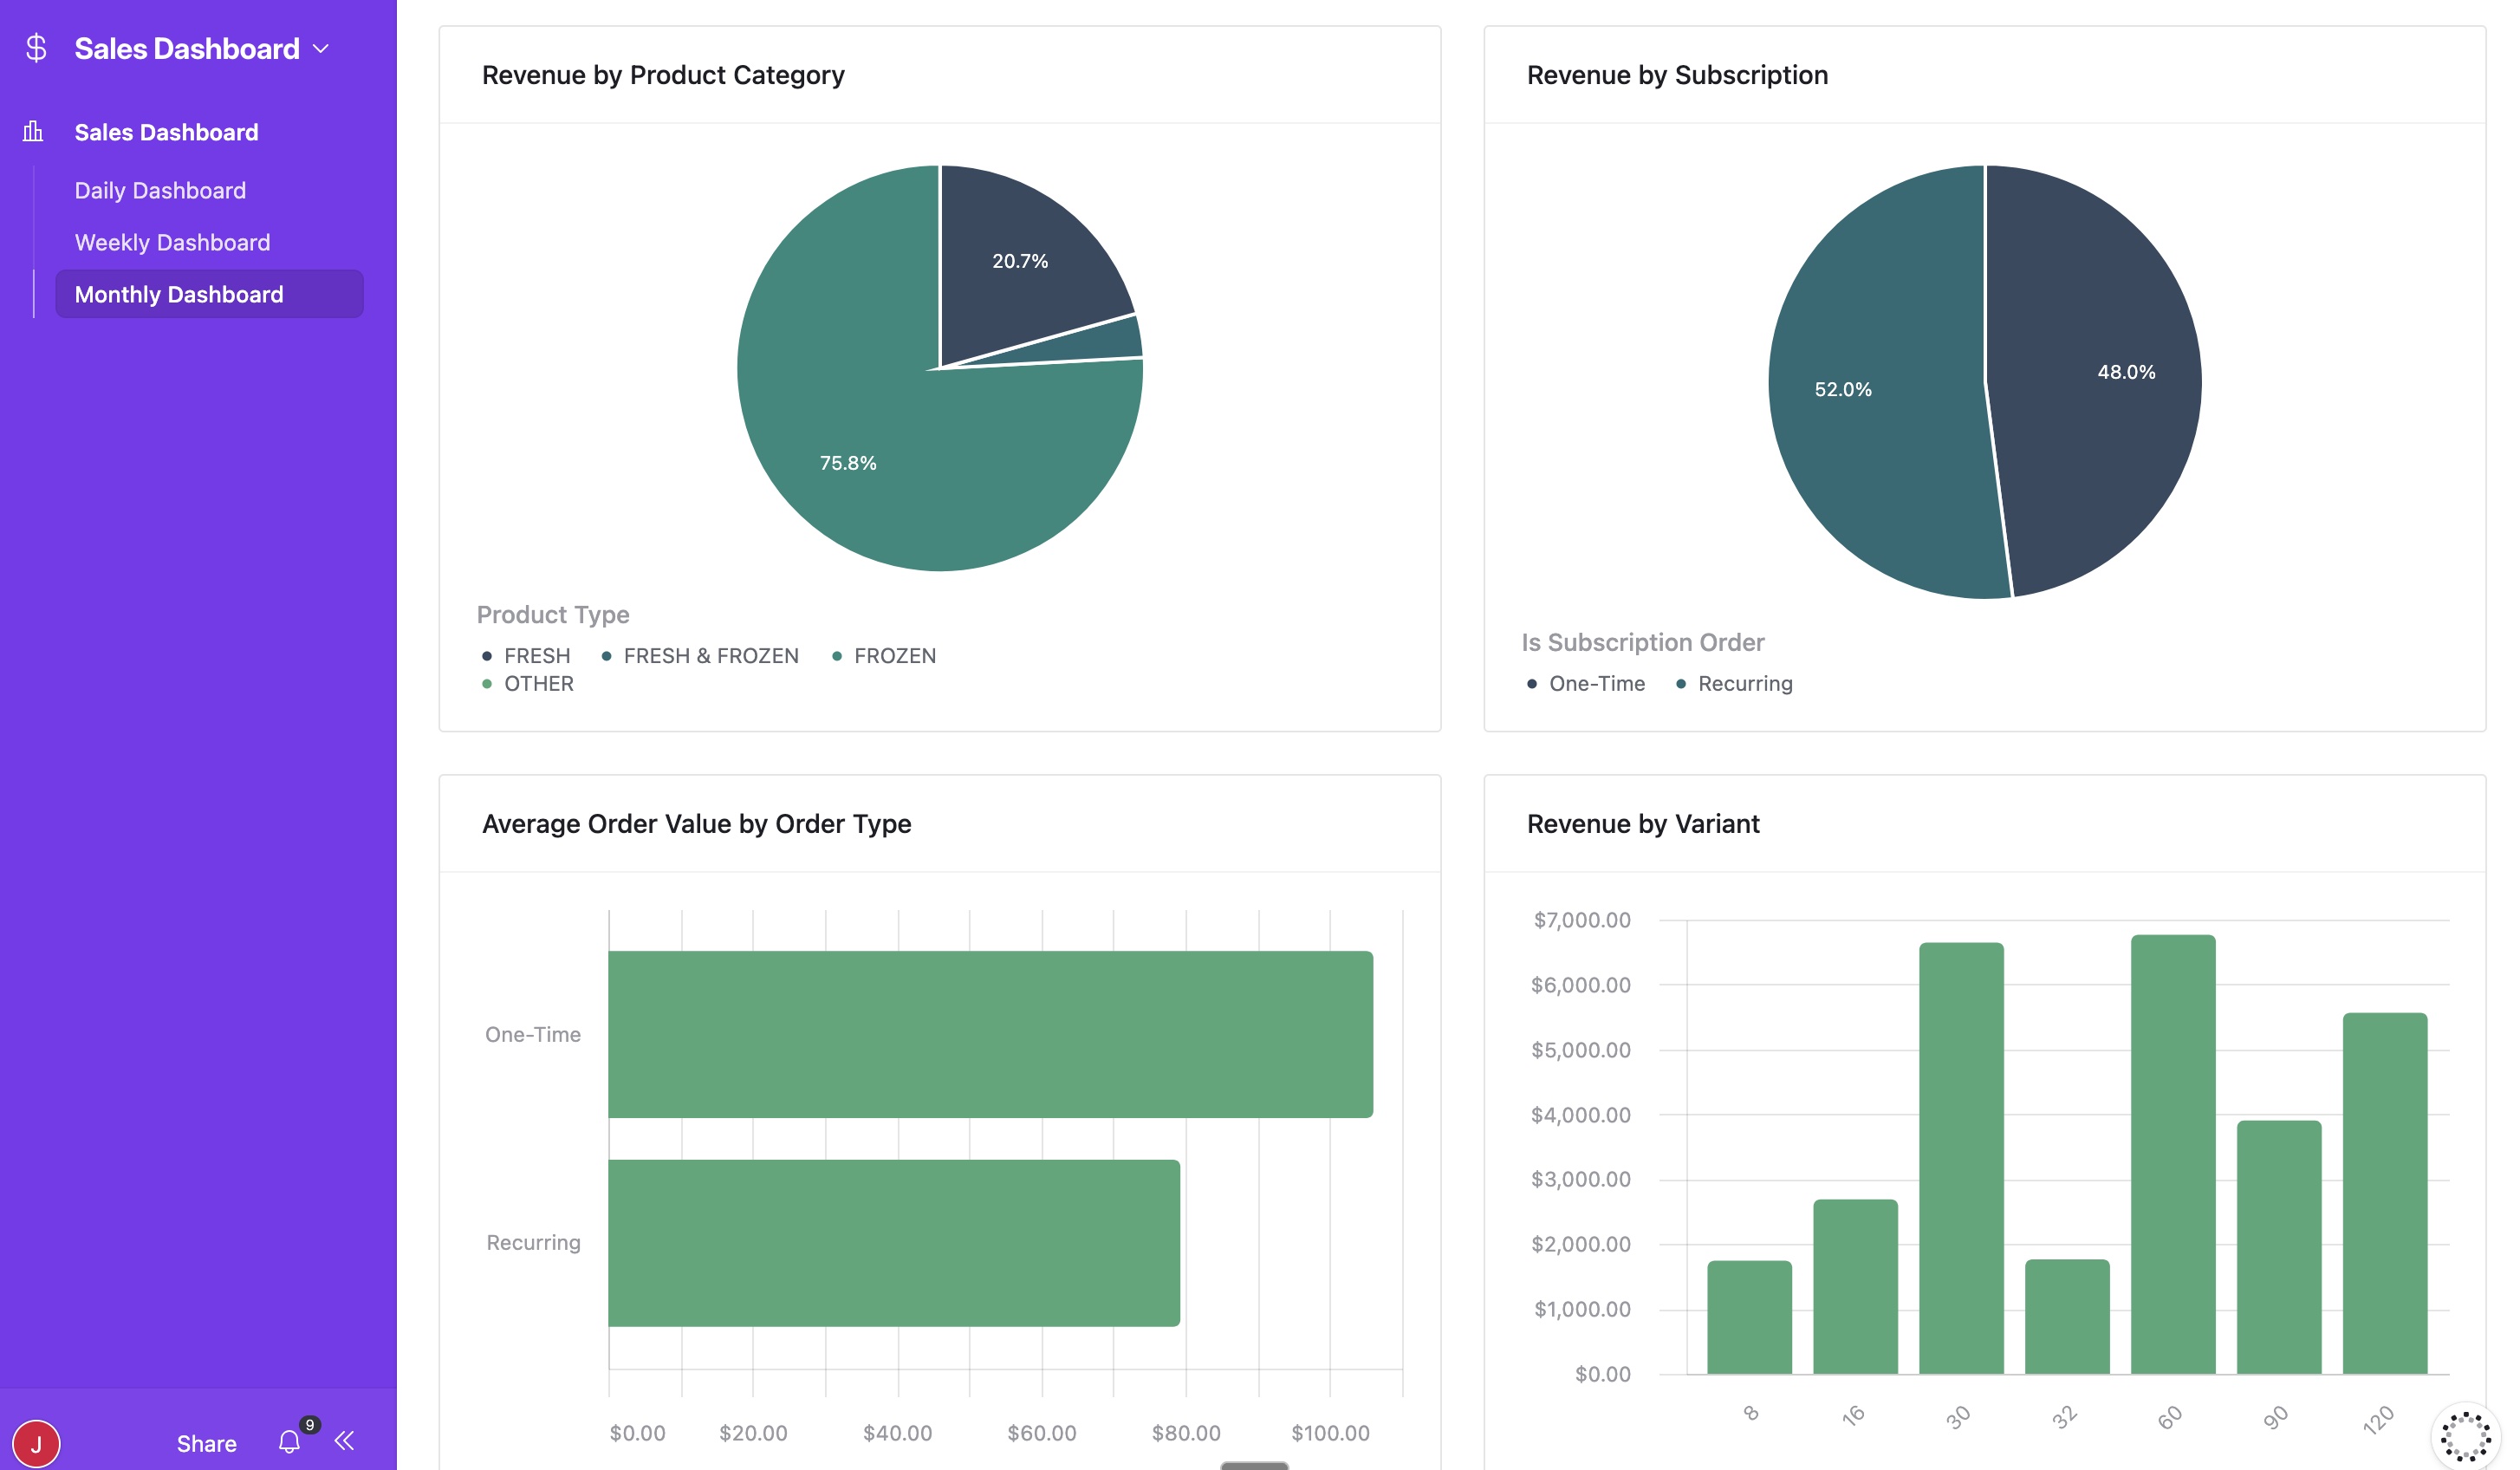
Revenue by product type and subscription split.
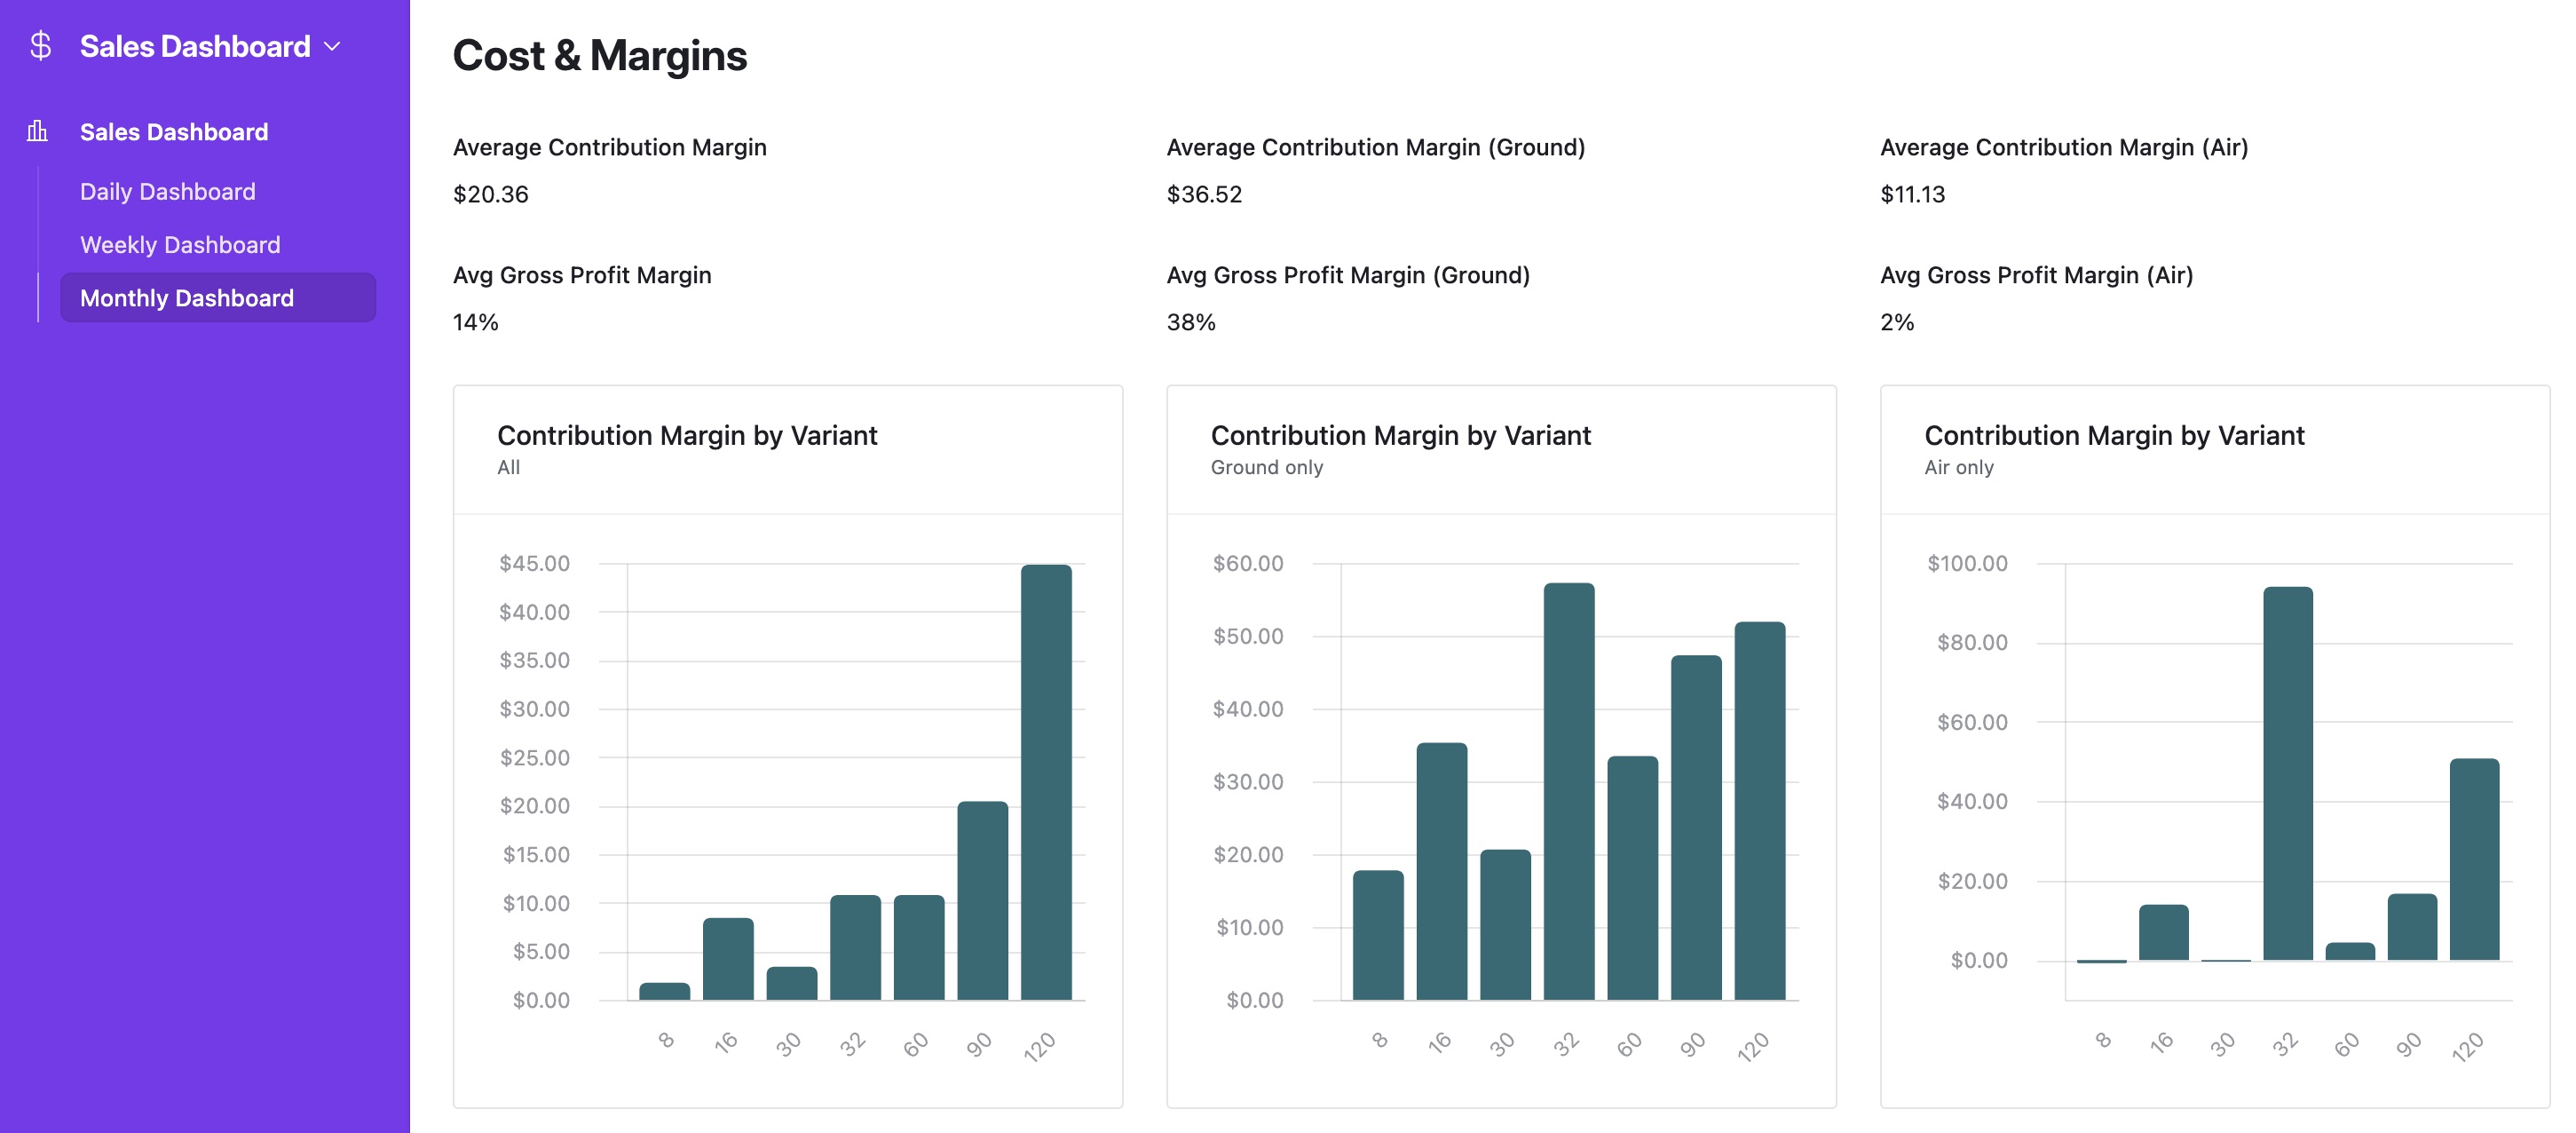
Contribution margin by variant, broken out by shipping method.
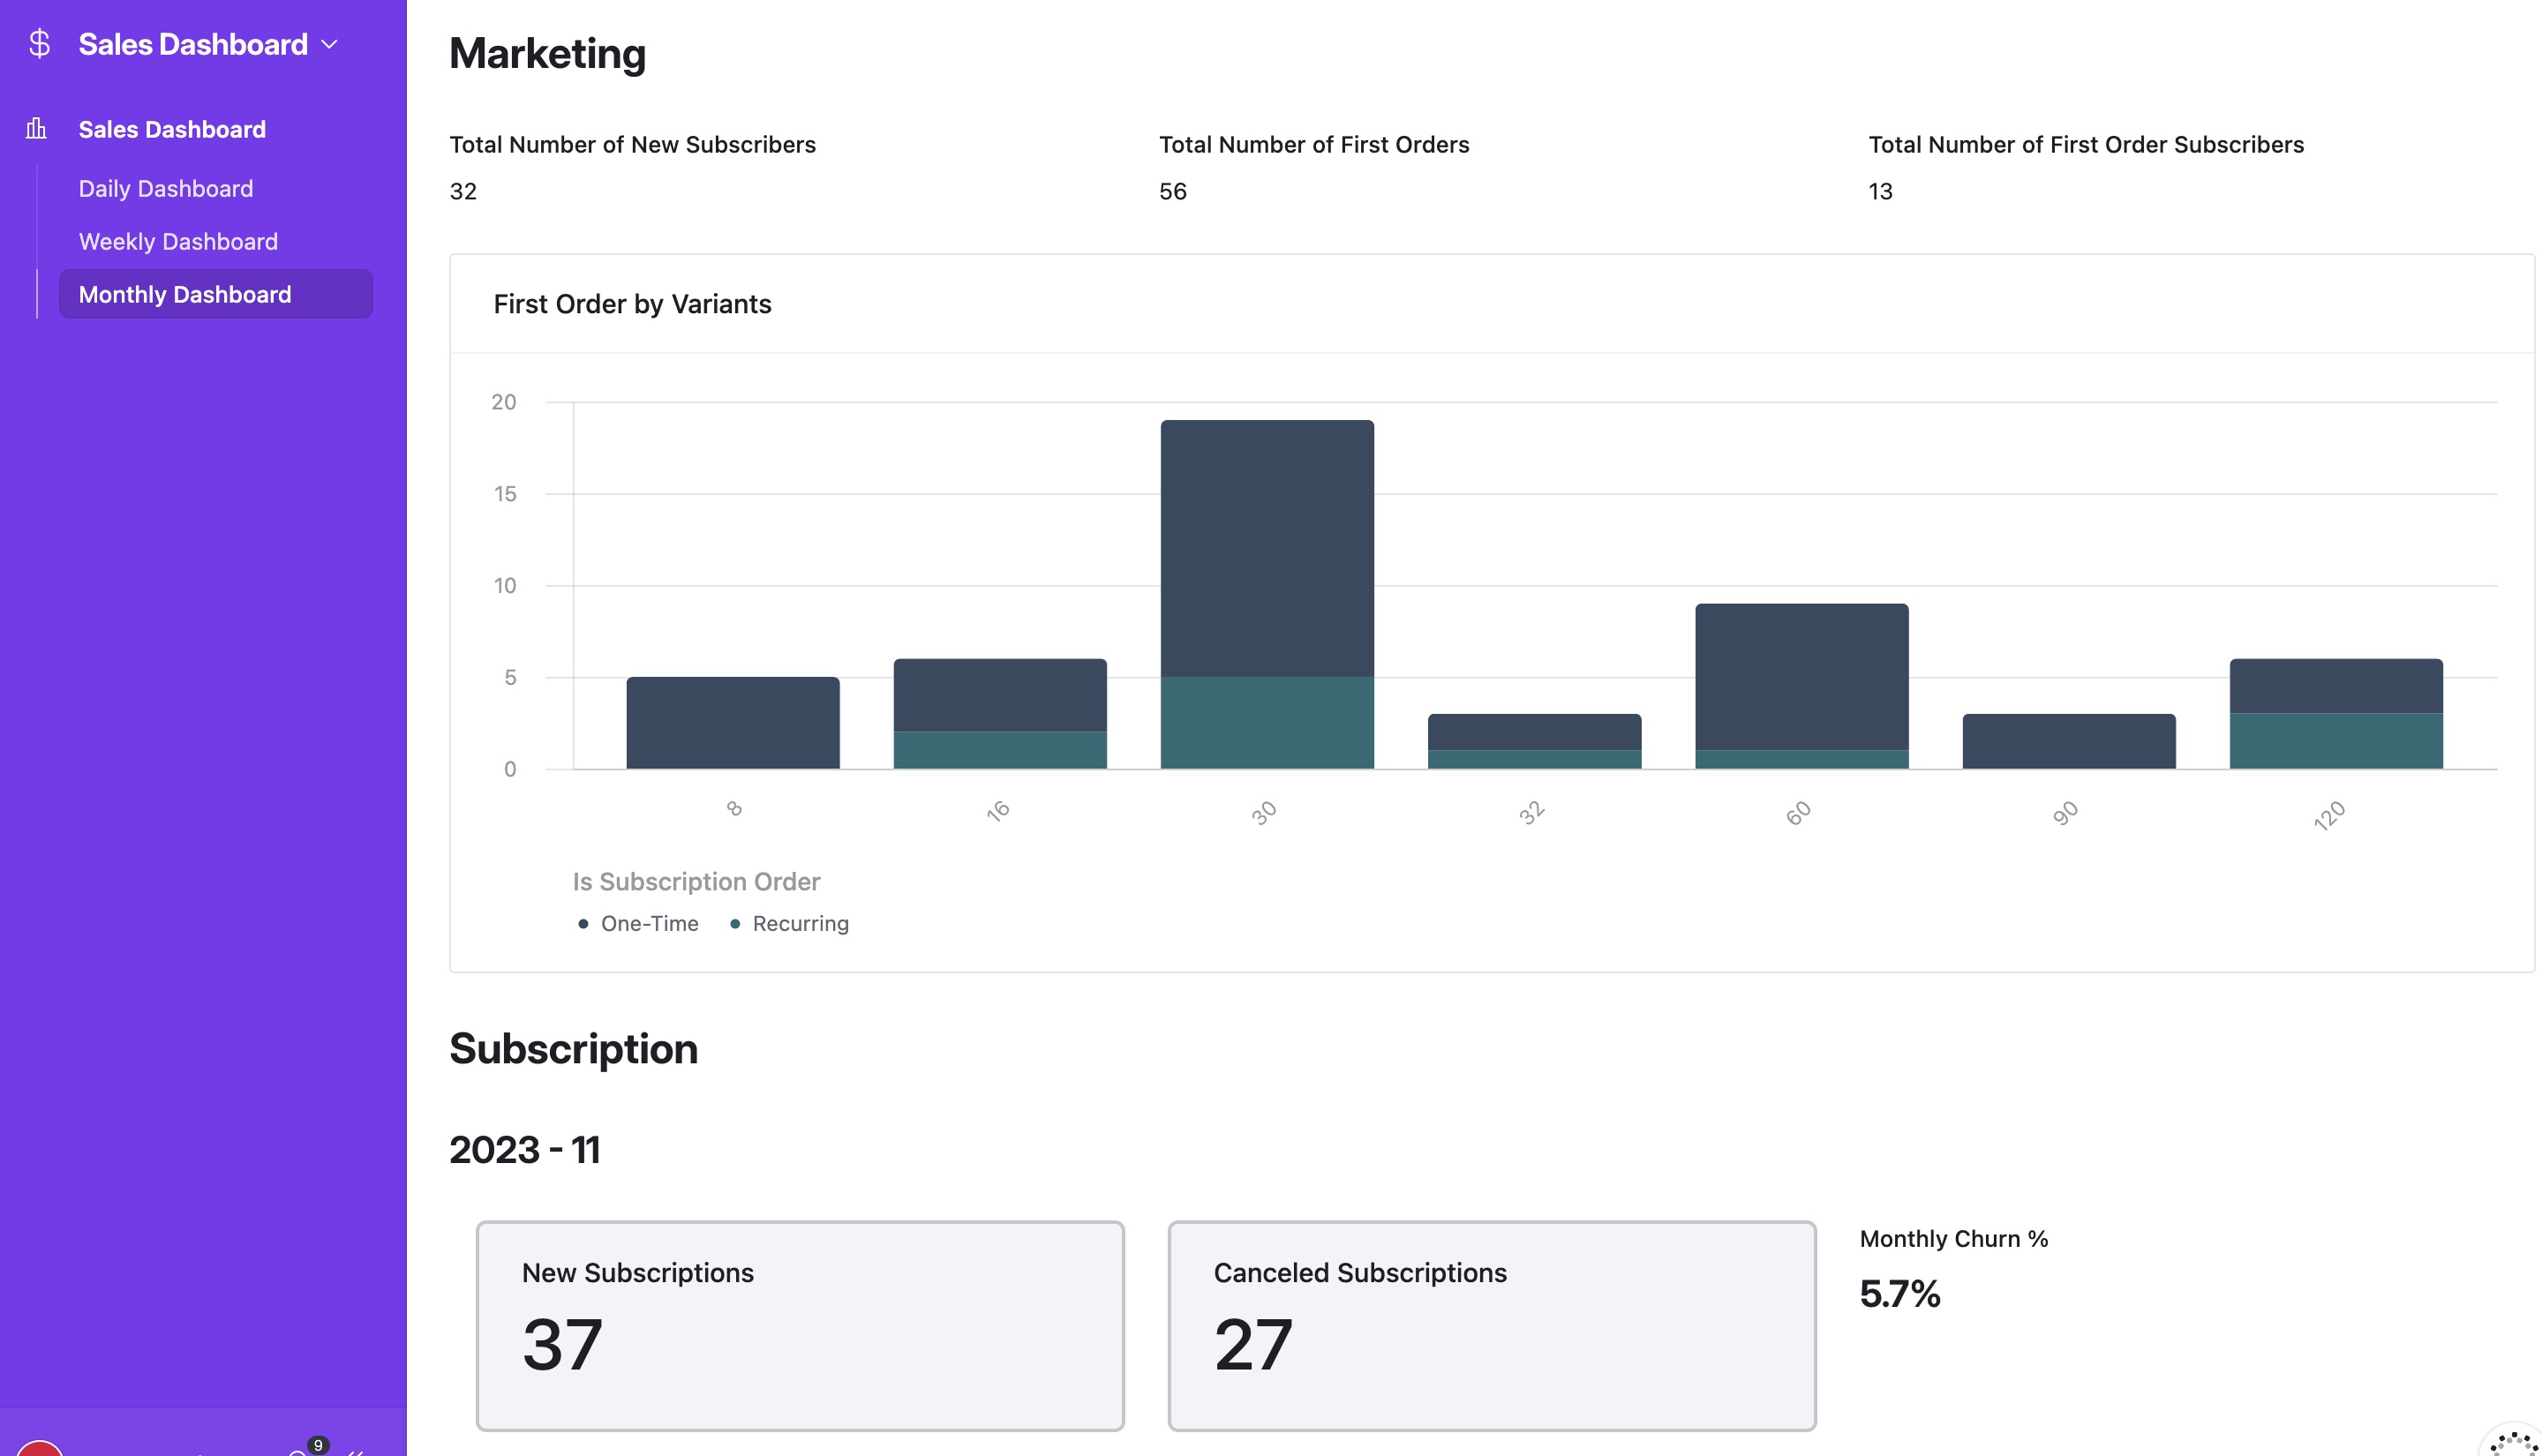
New subscribers, first orders, and monthly churn tracking.
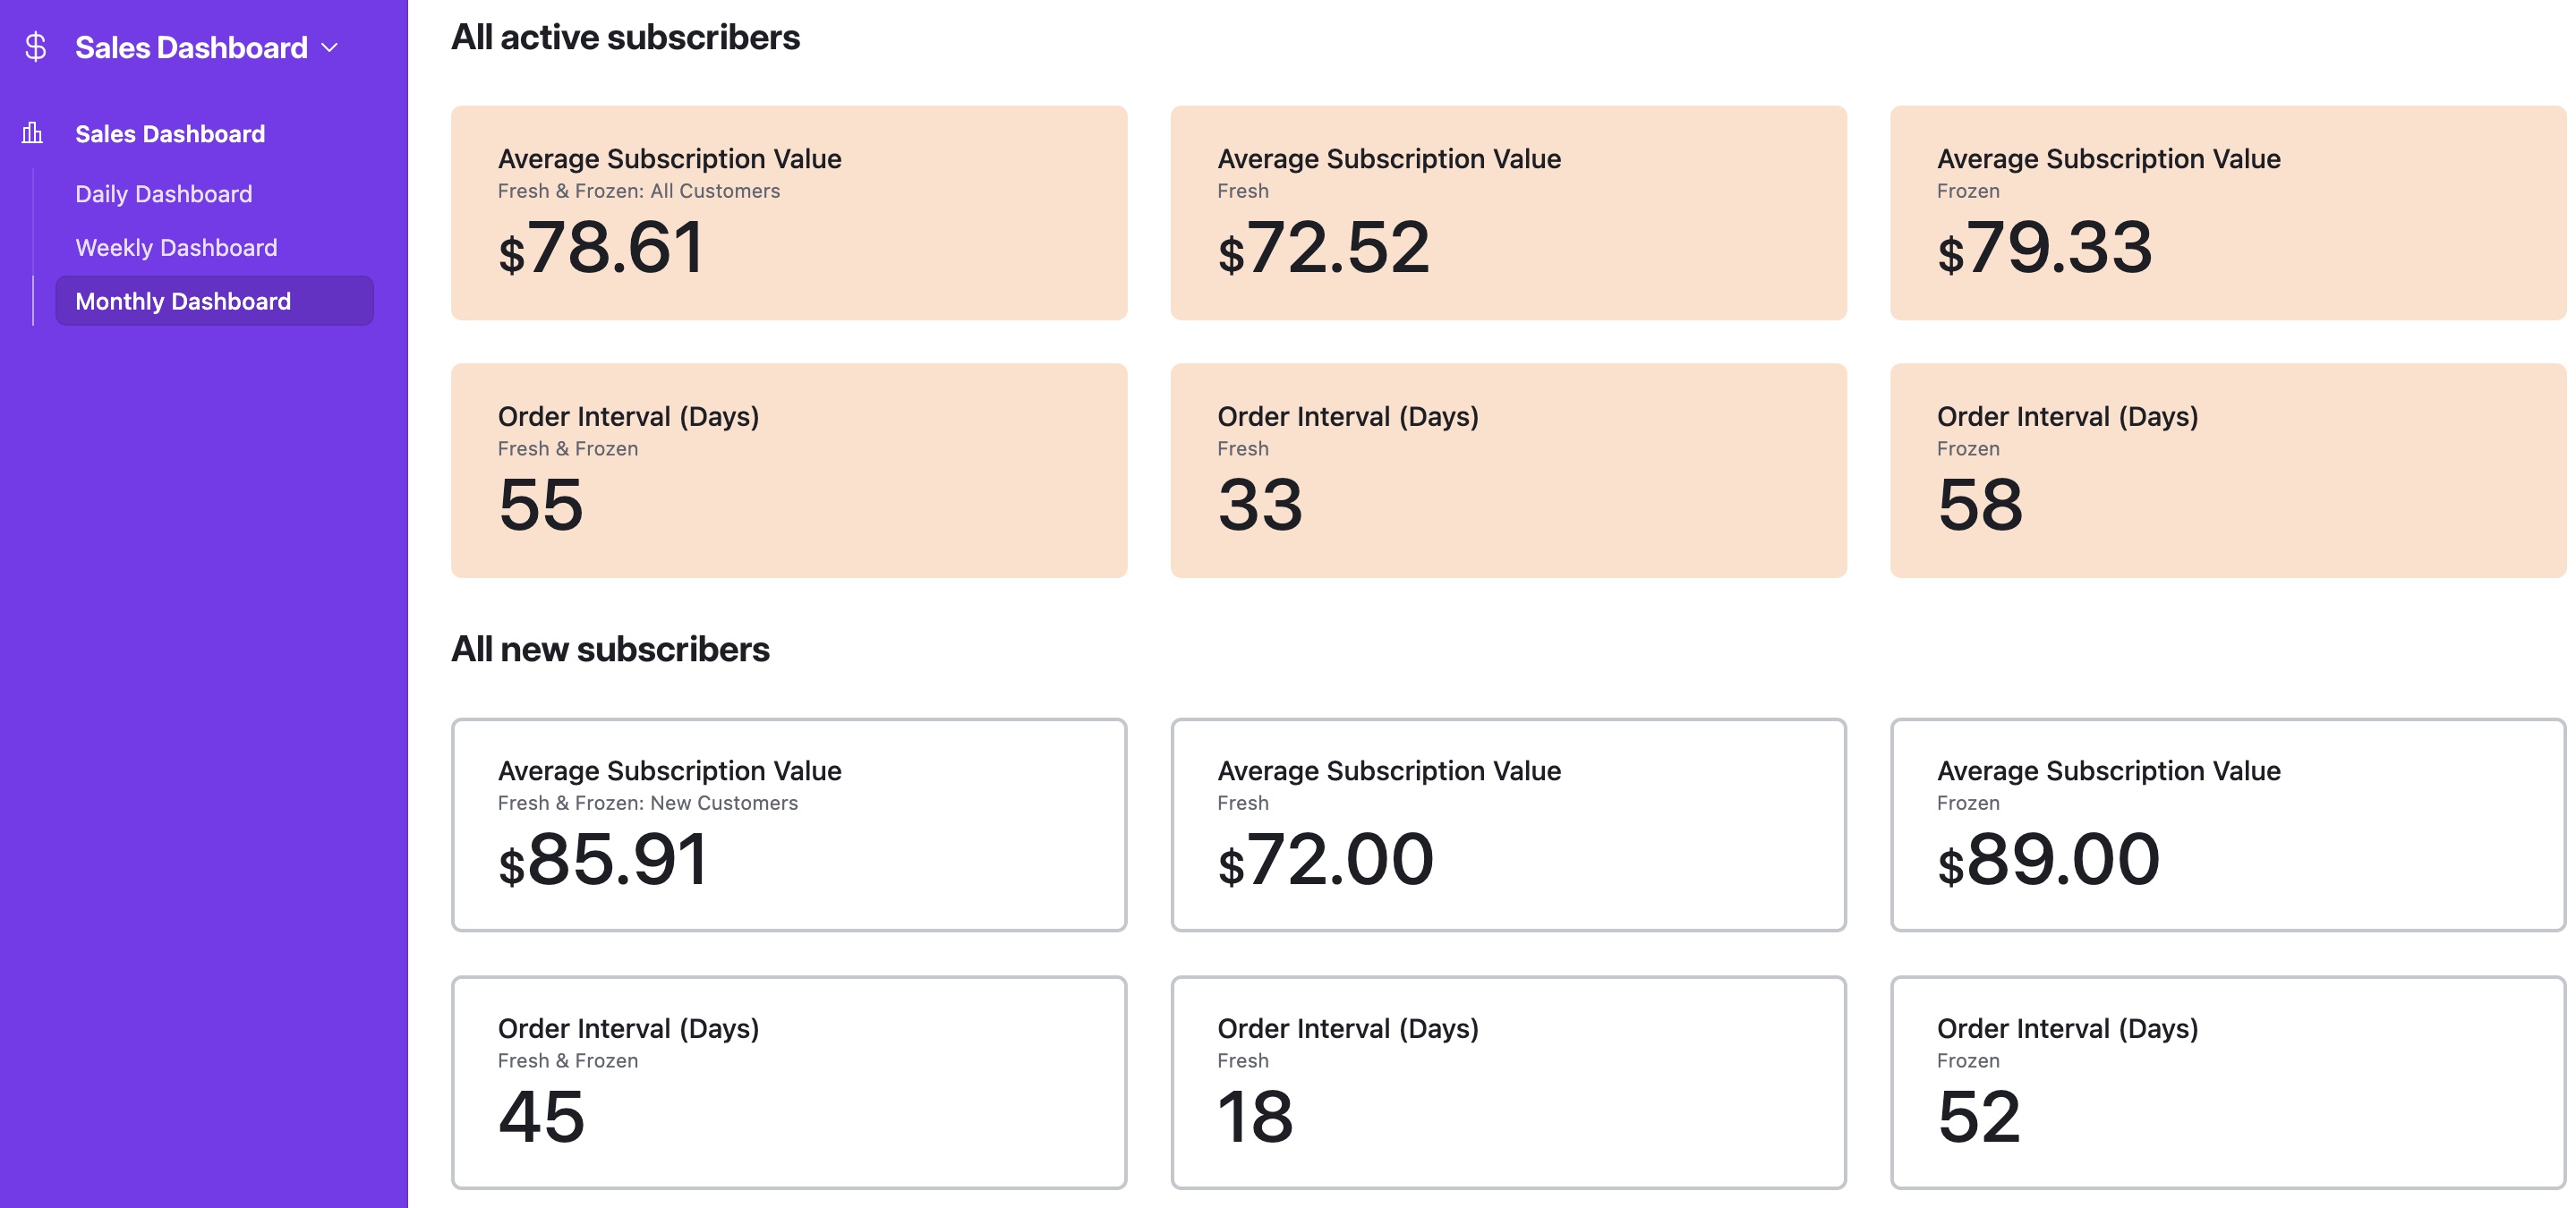
Average subscription value and order intervals by product type.
Order Volume Over Time
The chart below shows weekly fulfilled orders across 2023. The growth trend through the year and the peak weeks approaching 170 orders reflect a business running at real scale, not a side project. The system handled this volume without any increase in planning overhead.
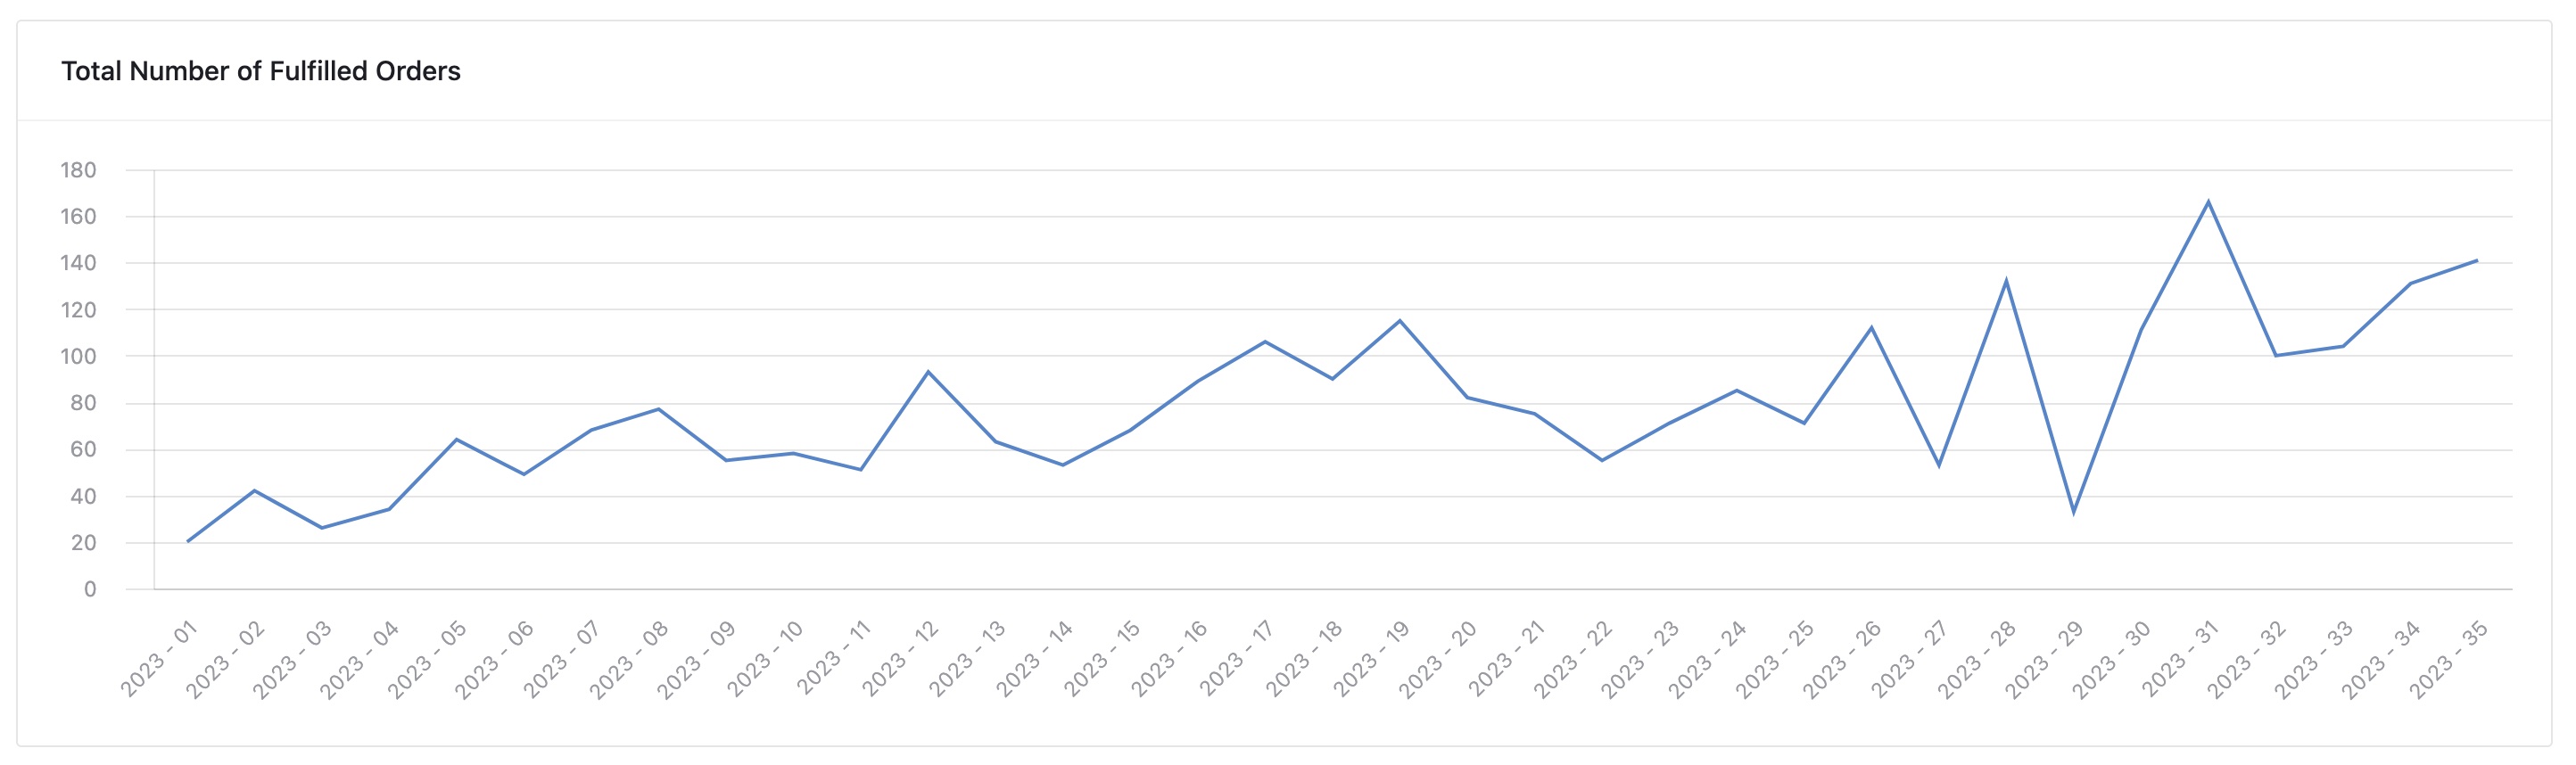
Total weekly fulfilled orders across 2023. Peak of 170 orders in a single week.
Then and Now
The fulfillment and inventory infrastructure wound down when the product line shifted. The sales and analytics layer is still running today on a leaner architecture of 9 automations, with added capabilities including low inventory warnings and automated email summaries.
The underlying logic is the same: real-time visibility into every KPI that matters for running a DTC business, built directly on order data rather than layered on top of a Shopify report. The system didn't just survive the transition. It got better because the foundation was built to be extended, not just operated.
Lessons Learned
01 Automate the work that doesn't require you. Planning a shipping day is a logistics problem, not a leadership problem. Every hour spent manually calculating dry ice quantities was an hour not spent on product, fundraising, or growth. The system paid for itself in reclaimed time within the first month.
02 Shared infrastructure beats individual knowledge. When the process lives in a database, anyone on the team can run it. When it lives in the founder's head, you have a single point of failure. Moving fulfillment planning into a shared system made the operation teachable, auditable, and resilient.
03 Real-time unit economics change how you make decisions. Knowing your cost per order after the month closes is accounting. Knowing it per shipment, as it ships, is operations. The difference is whether you can act on the information or just report it.
04 Build for extension, not just execution. The sales dashboard running today is a direct evolution of the system built in 2021. The fact that it could be stripped back, rebuilt, and extended without starting from scratch was a direct result of building on a proper data model from the beginning rather than patching spreadsheets together.